


Customer service teams and managers benefit from TeamSupport’s best-in-class, built-in reporting system featuring powerful new business intelligence capabilities at your team’s fingertips.
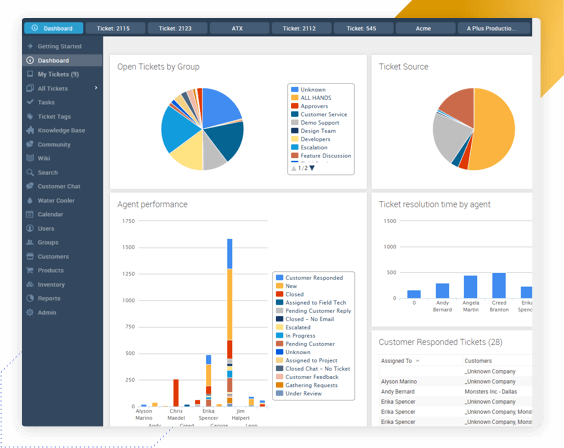
Dashboards are user-specific. They can (and should) be customized based on personal preference, and no other user can change them for you, or be affected by your changes.
Add any help desk report, move items to appear in the order you prefer with simple drag and drop functionality, and hide/unhide series from the display with a simple click. You can also access listed tickets simply by clicking on the ticket link.
Several predefined “stock” reports come standard as a part of your TeamSupport subscription, and you can add any report to your dashboard to have this information at your fingertips.
The help desk metrics dashboard allows custom views so each user can showcase the information they need. Report features include filtering, report cloning, enhanced sorting, and individual viewer functions.
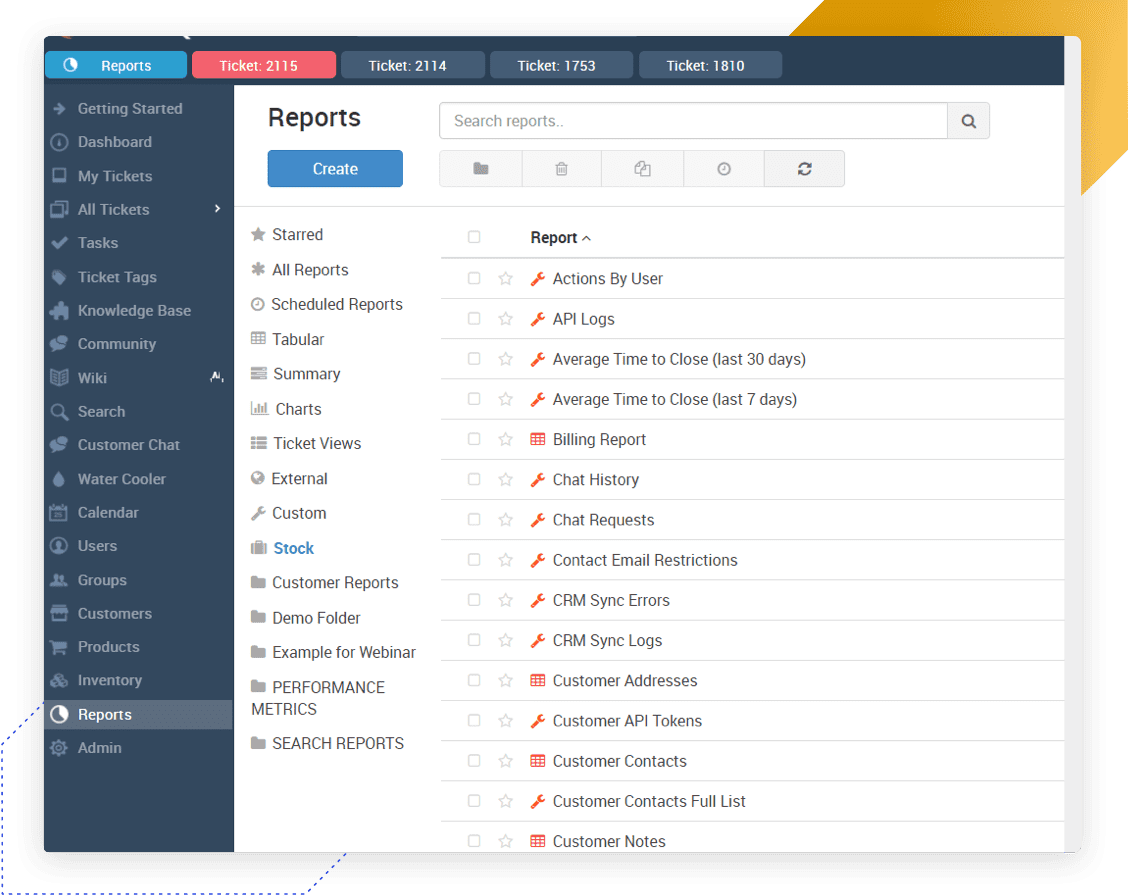
TeamSupport offers advanced reporting capabilities with wizard-based creation that you can use to view your data in virtually any way you want.
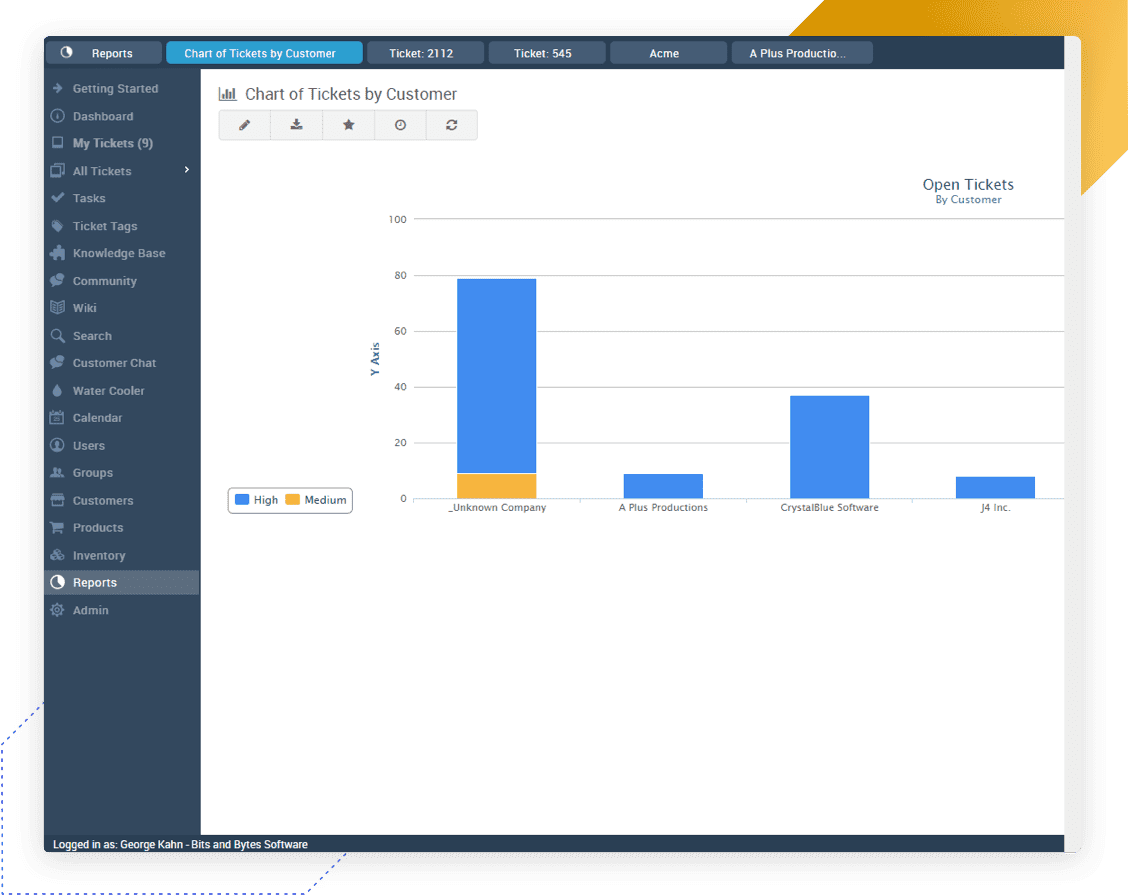
You can create custom help desk reports and ticket views to easily access information and analyze data. You can also create several report types including summary, tabular, chart, or graph, and organize your reports by creating custom folders.

Interested in seeing what TeamSupport can do for you? Sign up for a live demo and see for yourself why TeamSupport is the industry's top help desk software.


